Some of you may know that my husband Tobias is a web developer. And not just any web developer but one with a passion for web performance optimization (WPO). WPO is about loading and showing a web page as fast as possible as this has proven to increase time on site, number of clicks and sales (for webshops). Also web users perceive fast pages and their brands as more professional. In general, WPO improves the user experience.
Tobias was not particularly happy with Retr-O-Mat‘s performance. To quote him verbatim:
For the first time I’m unhappy you assumed my name
Gee thanks, honey! After all, Retr-O-Mat’s performance was average (3 seconds for complete document) not abysmal. But average is not good enough for the WPO guy’s wife, so here I sit optimizing away. And blogging about it.
The following is not a howto for WPO but a case study of the things I did. Maybe you can apply some of it to your site.
1) Removing a superfluous external script
Oops! In the header I linked an external script for Ajax calls from back when I thought I’d use PHP and JS. For a long time now I have a pure JS solution. No need for Ajax anywhere. But I’d never removed that link. Stooopid!
Measuring progress
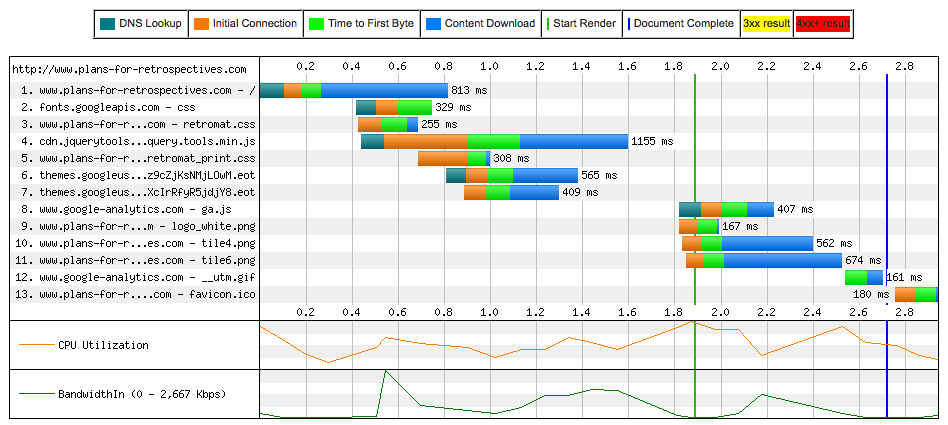
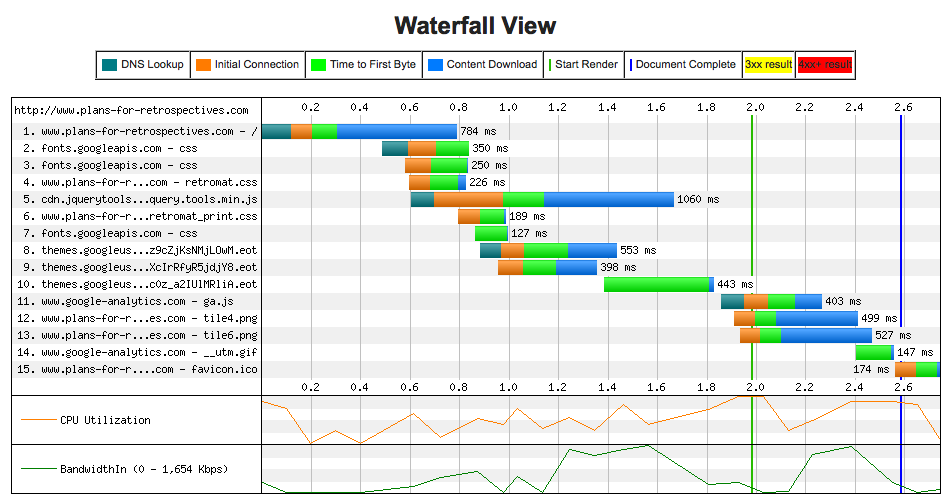 I realized that I might be optimizing all day and started to measure. To the left is the result of webpagetest.org for Retr-O-Mat, after removing the script-link but before any other change. We configured the test to reflect an average German DSL connection (Frankfurt, 1500Kbps, 70ms latency) with an average-speed browser (IE8).

Each bar represents a file that’s loaded. The colors indicate time for ‘DNS lookup’, ‘connecting to IP’, ‘server-side processing time’, and ‘actually downloading’ respectively.
You might notice that there are never more than 5 bars in progress at any point in time. Apparently IE8 limits the number of parallel http requests. In fact, many browsers limit the maximum number of simultaneous requests per page and servers limit the number of requests per IP. Lower the number of http requests to increase performance. This is more important than minimizing file sizes.
One common way to save http requests is CSS sprites: Combine all your images into one big image and show just parts of that image via CSS. I can’t go down that route as I only use 3 images (+ favicon) and 2 of those are repeating backgrounds. Repeating backgrounds aren’t possible with CSS sprites 🙁
So what else can I do? My goal is to get the green and blue line as much to the left as possible.
2) Optimizing webfonts
I use 3 fonts: Lemon for writing “Retr-O-Mat”, Droid Serif for heading and Droid Sans for everything else. Including a whole font for just one word is overkill. I’ll replace it with an image (2 actually: white for the web page, black for the print version). Doesn’t save a request but saves file size.
Then I thought I could combine my remaining 2 font requests into 1 using a pipe:
<link rel=”stylesheet” type=”text/css” href=”http://fonts.googleapis.com/css?family=Droid+Sans|Droid+Serif” />
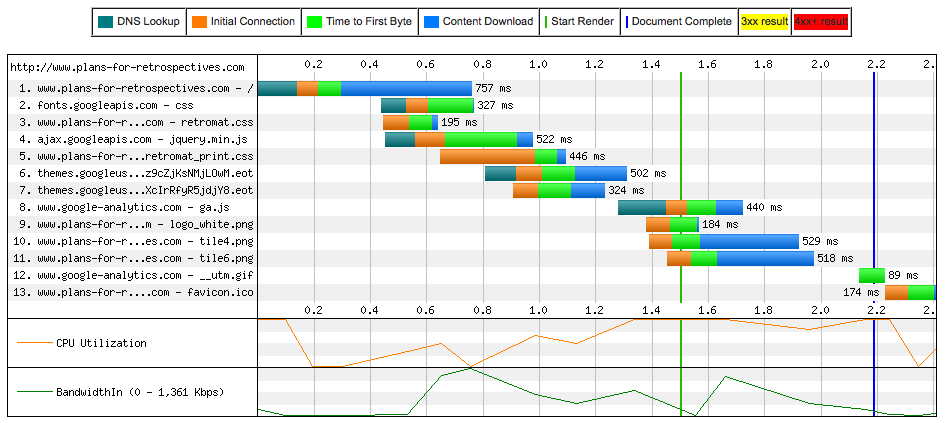
But there’s still 2 requests to themes.googleus:
As the fonts now finish loading 0.4 seconds earlier I don’t care too much. What I do care about is the delay before Google Analytics. It seems to lag quite a bit. We’ll tweak that later. First we’ll address the biggest culprit:
3) jQuerytools -> jQuery
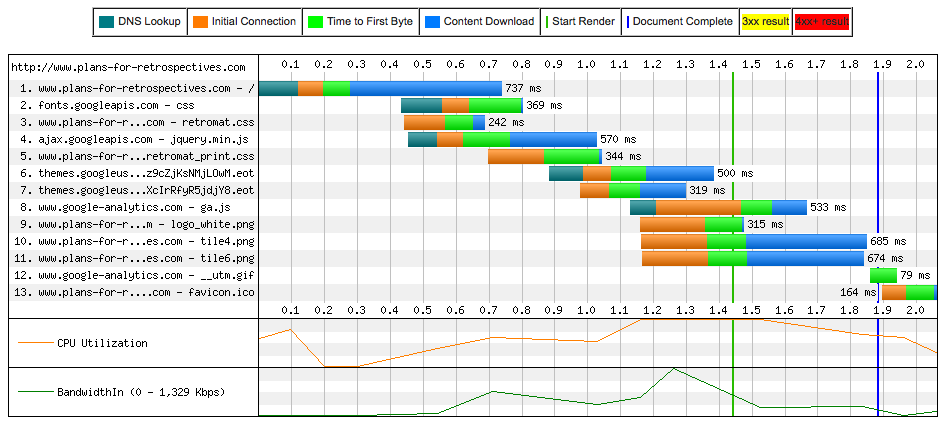
The longest bar is for jQuery. Or so I thought. Turns out ‘jQuerytools’ is not the same as ‘jQuery’. Just as the removed superfluous script, jQuerytools probably provides a functionality I don’t use anymore. I only need jQuery, which is smaller. I now link to a Google jQuery mirror instead:
Booya, down to 2 seconds if it weren’t for Analytics.
4) Tweaking Google Analytics
Now we’ll address the Google Analytics delay. You integrate Google Analytics by copying a small JS script into your header. Surprisingly, the script provided by Google is not optimized. Here is an optimized script to integrate Google Analytics.
That delay is history.
5) Abolish the print.css
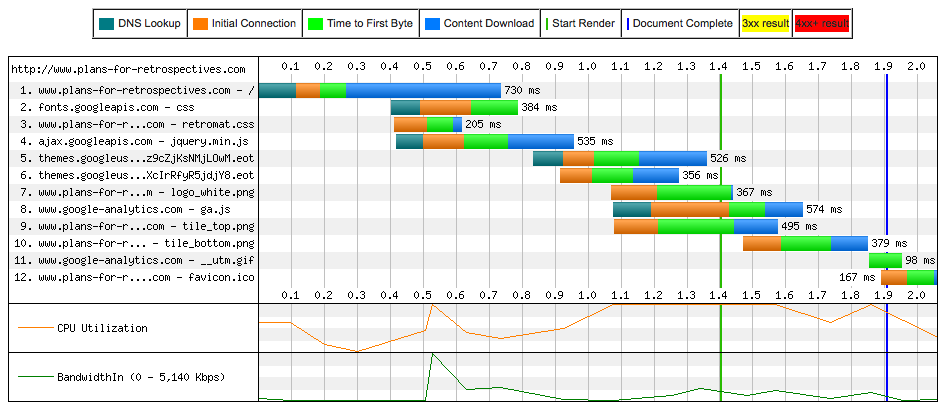
If you’ve studied the separate requests you might have noticed the request for “retromat_print.css”. Dafuq? Why would something for ‘media=”print”‘ load when I look at a webpage?
Apparently browsers follow a different logic. They all always load all style sheets regardless of media-type. That sucks.
But fear not. The workaround is to put your print-specific CSS at the bottom of your normal CSS like this:
@media print {
  /* your print-specific CSS here */
}
Saved another request:
Damn, 0.1 seconds more. That’s what I get for running single tests and not averaging over several runs. The gods of scientific rigor strike me down. If I coded websites for a living I’d rollback and average over step 4 for a meaningful comparison. But this is a private project, I’m too lazy to step back and reasonably sure it’s temporary variances. Deal with it.
From now on I’ll compare the median of 5 runs. At the end of step 5 that’s
| Loaded: 2.053s | First Byte: 0.347s | Start Render: 1.418s |
6) Minify images
I’d already minimized the background patterns once, but Tobias insisted on working his minifying mojo.
In Photoshop he saves the images as PNG8 with “save for web”, no dithering, adaptive colors, 8 colors (depends on the motif of course).
Then he uses OptiPNG for compression and PNGOUT or Pngcrush to remove the loads of meta-info Photoshop writes into files. On the Mac ImageOptim combines all these tools for you.
This way he cut the file size of the patterns down 10 KB each from 25 to 15Kb. The final figures:
| Loaded: 1.907s | First Byte: 0.264s | Start Render: 1.401s |
Of course, Tobias wouldn’t stop here – it’s not yet at the 1.6 seconds that are industry standard for high performance websites. But we’ve carved out nearly a second (Thank you, Tobias!) and that’s good enough for me. I’d rather add activities to Retr-O-Mat 🙂
If you on the other hand, would like to learn more about WPO you can join Tobias in the Cologne Web Performance Optimization Group. Not from the Rhineland? There are groups around the world. Or search for #webperf on Twitter to find interesting starting points.

